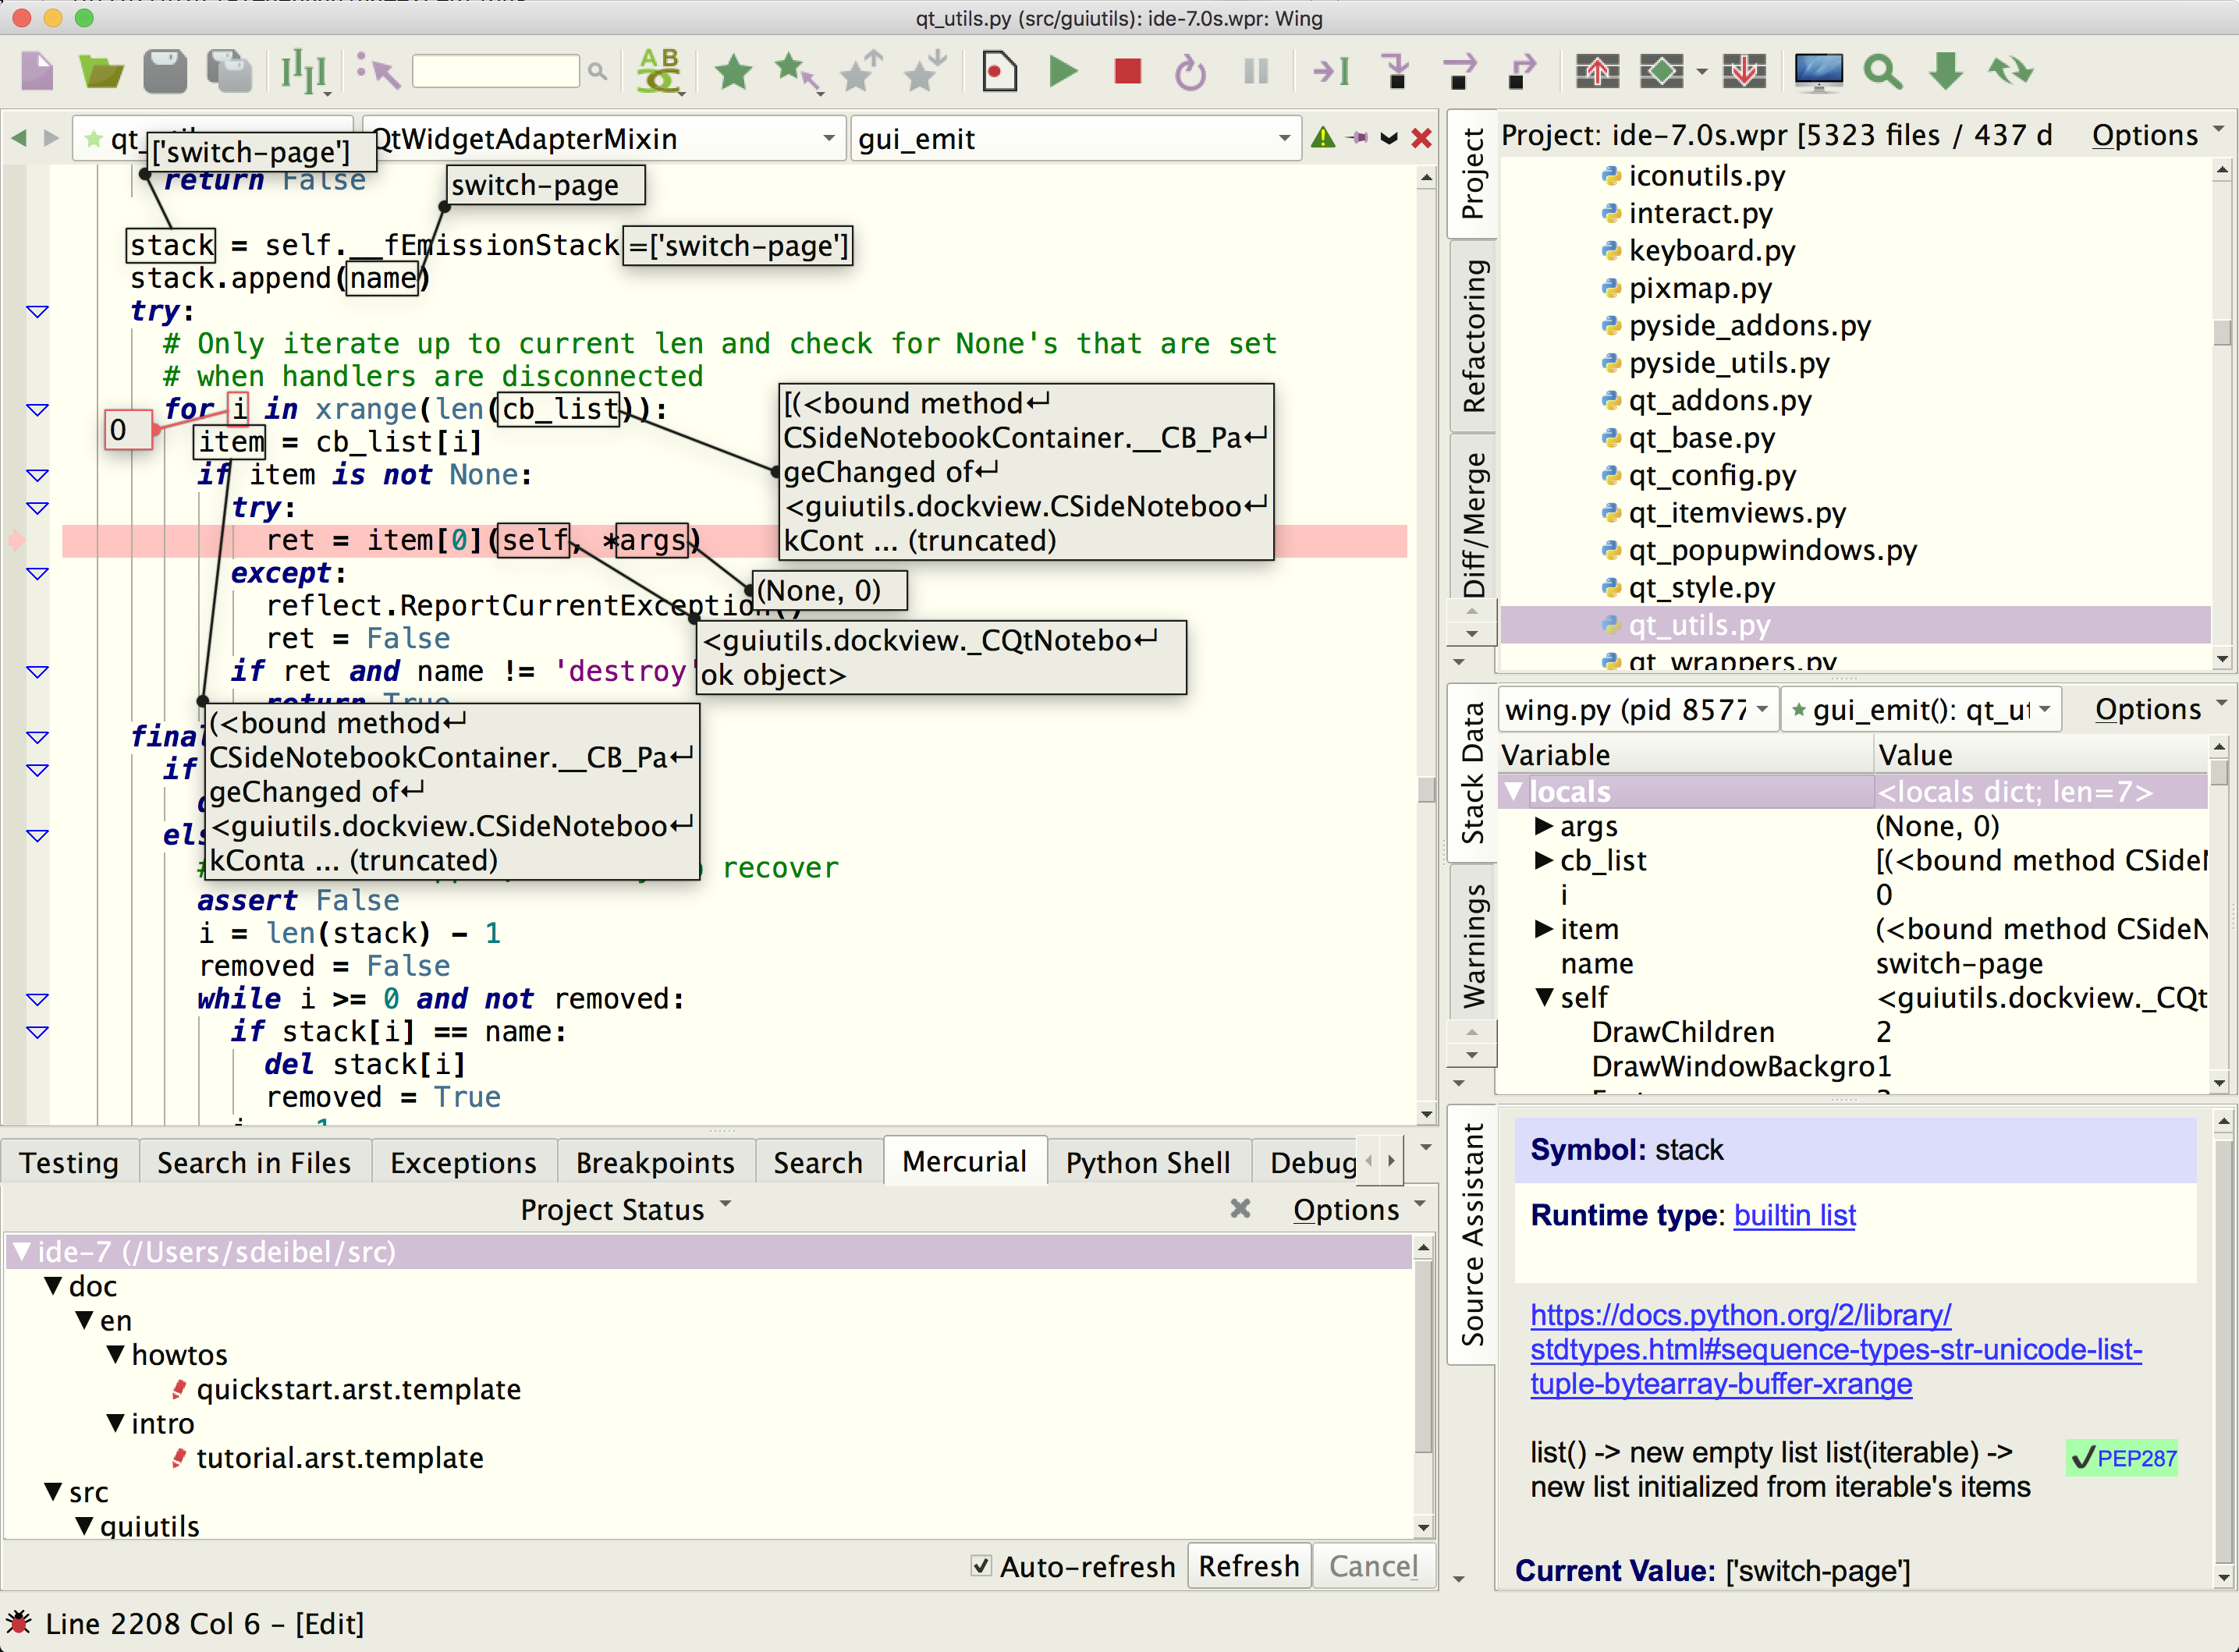
Using Wing with PyXLL

Wing Pro is a Python IDE that can be used to develop, test and debug Microsoft Excel add-ins written in Python with PyXLL.
This document focuses on configuring Wing to debug Python code running in Excel. To learn more about Wing in general, please refer to the Tutorial in Wing's Help menu or read the Quickstart Guide.
Introduction
PyXLL is a commercial product that embeds Python into Microsoft Excel on Windows. It allows you to expose Python code to Excel as worksheet functions, macros, menus, and ribbon toolbars.
PyXLL add-ins can be developed, tested, and debugged using Wing. Wing's remote debugger is used to connect to Excel in order to debug the Python code.
Installation and Configuration
Take the following steps to set up and configure Wing for use with PyXLL:
- Install PyXLL as described in the PyXLL user guide. Be sure the follow this guide to the end and install the optional PyXLL wheel using pip.
- Install Wing if you don't already have it.
- Launch Wing from the Start menu on Windows.
- Create a new project in Wing with New Project in the Project menu. Select Create Blank Project as the project type and press Create Project. Then use Project Properties in the project creation confirmation dialog or Project menu to set Python Executable to Command Line and then enter the full path to the Python you are using with PyXLL. This is the same value used for executable in the PyXLL config file.
- Locate the folder where you have installed PyXLL and in Wing select Add Existing Directory from the Project menu to add it to your project. Also add any other directories that store the source code you are working on.
- Save your project to disk with Save Project As in the Project menu.
Debugging Python Code in Excel
This section describes how to debug Python code running in the Excel process through the PyXLL add-in.
- Copy wingdbstub.py from the Install Directory, listed in Wing's About box, accessed from the Help menu, into a directory listed on the pythonpath in your PyXLL config file. If you are just starting with PyXLL, this could be the examples folder in your PyXLL folder.
-
Open your copy of wingdbstub.py and make the following changes:
- Make sure WINGHOME is set to the full path of the Wing installation from which you copied wingdbstub.py. This may already be done, since it is usually set automatically during installation.
- Change the value of kEmbedded to 1. This tells Wing's debugger that you are working with an embedded copy of Python, which affects some aspects of how code is debugged.
-
Add wingdbstub to the modules list in your pyxll.cfg file:
[PYXLL]
modules =
  wingdbstub
  ...
-
Make sure the Debugger > Listening > Accept Debug Connections preference is enabled on in Wing, to allow debug connections from the Excel process. This can also be enabled by clicking on the bug icon in the lower left of Wing's window.
Now hovering your mouse over the bug icon should show that Wing is listening for externally initiated debug connections on the local host.
If Wing is not listening, it may be that it has not been allowed to do so by Windows. In that case, try restarting Wing so that Windows will prompt you to allow network connections.
- Set any required breakpoints in your Python source code by clicking on the leftmost margin next to the code in Wing's editor, or with the breakpoint items in the Debug menu.
- Restart Excel or reload the PyXLL add-in so that the wingdbstub module is imported. You should see the status indicator in the lower left of Wing's window change to yellow, red, or green, as described in Debugger Status.
- Call a Python function from Excel that will reach a breakpoint.
When a breakpoint is reached, Wing will come to the front and show the file where the debugger has stopped. If no breakpoint or exception is reached, the program will run to completion, or you can use the Pause command in the Debug menu.
Trouble-shooting
If this doesn't work at first, try using wingdbstub.Ensure() to force wingdbstub to make the connection to the debugger. The following code creates an Excel worksheet function that, when called, ensures the debugger is connected:
from pyxll import xl_func
import wingdbstub

@xl_func
def debug_test():
    wingdbstub.Ensure()
    return "Connected Ok!"
If this code can't connect then check that the Wing application is allowed to make network connections in your Windows Firewall settings. To do this, go to the Windows Start menu and type "Allow an app through Windows firewall", select "Change Settings" and then "Allow another app...". Navigate to the Wing installation folder and select the Wing executable from the bin folder. Restart Wing and Excel and now the two should be able to connect.
If you still have problems making this work, try setting the kLogFile variable in wingdbstub.py to log additional diagnostic information. This diagnostic output can be emailed to support@wingware.com for help.
Related Documents
Wing provides many other options and tools. For more information:
- PyXLL website.
- Debugging Externally Launched Code.
- Quickstart Guide contains additional basic information about getting started with Wing.
- Tutorial provides a gentler introduction to Wing's features.
- Wing Reference Manual documents Wing in detail.


