Using Wing with Jupyter Notebooks
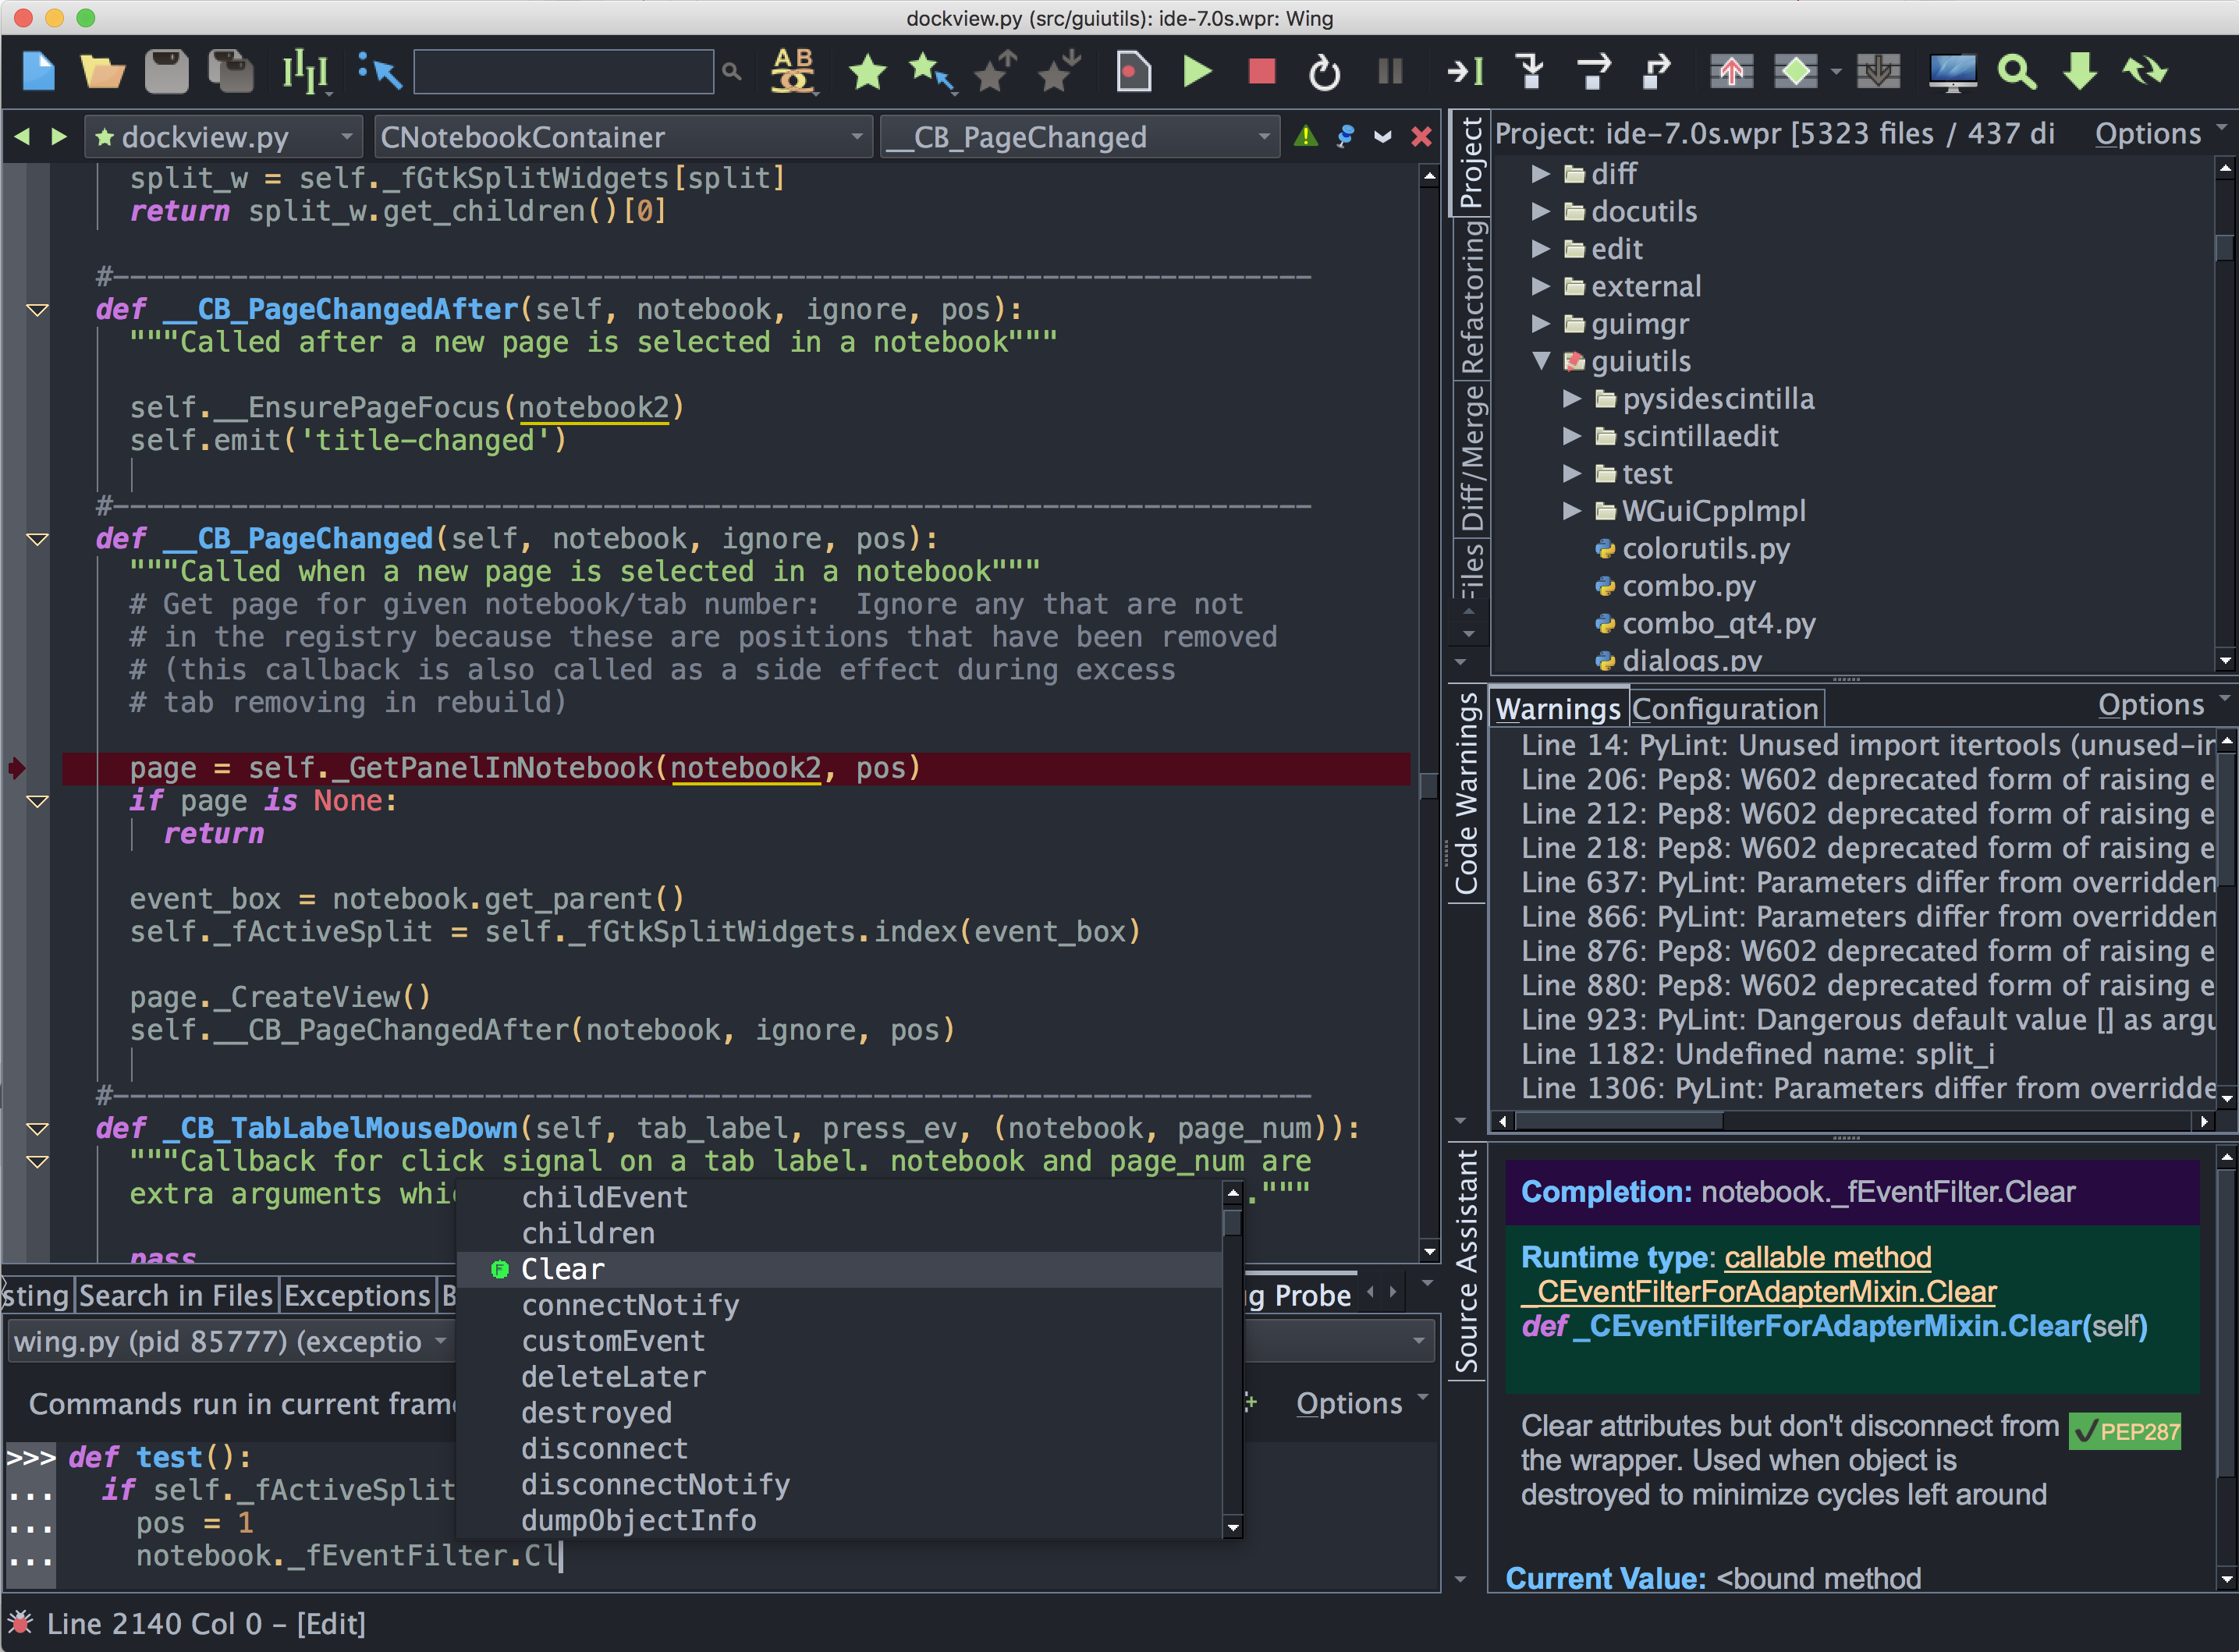
Wing Pro is a Python IDE that can be used to develop, test, and debug Python code written for Jupyter, an open source scientific notebook system.
If you do not already have Wing Pro installed, download it now.
This document describes how to configure Wing for Jupyter. To get started using Wing as your Python IDE, please refer to the tutorial in Wing's Help menu or read the Quickstart Guide.
Setting up Debug
Since Jupyter is started outside of Wing, you will need to initiate debug from your code or from the Jupyter notebook. There are a few configuration options that need to be set correctly for this to work properly.
Limitation: Jupyter does not provide a usable filename for code that resides directly in a notebook .ipynb file (it is simply set to names like <ipython-input-1>). As a result you cannot stop in or step through code in the notebook itself. Instead, you need to place your code in a Python file that is imported into the notebook, and then set breakpoints and step through code in the Python file.
Configure wingdbstub.py
To initiate debug, you will need to copy wingdbstub.py out of your Wing installation (on macOS it is located in Contents/Resources within the .app bundle) and place it in the same directory as your .ipynb file.
You may need to set WINGHOME inside of wingdbstub.py to the installation location of Wing. This is set automatically during installation of Wing except on macOS, on Windows if you use the zip installer, and on Linux if you use the tar installer. An alternative to editing wingdbstub.py is just to set the environment variable WINGHOME before you run jupyter notebook.
Listen for Debug Connections
Next, tell Wing to listen for externally initiated debug connections by clicking on the bug icon in the lower left of Wing's window and checking on Accept Debug Connections.
Starting Debug
Now add code like the following to the top of your Jupyter notebook:
import wingdbstub
wingdbstub.Ensure()
When you run that cell, Wing will start debugging Jupyter. You should see Wing's toolbar change and the Stack Data tool should show one running process:

Working with the Debugger
To try out debugging, save a file named testdebug.py in the same directory as your .ipynb file with the following contents:
def run():
    print("Hello world")
    x = 1
    print("Done")
Open this in Wing and place a breakpoint on the first line by of the body of run() by clicking on the breakpoint margin to the left, as follows:
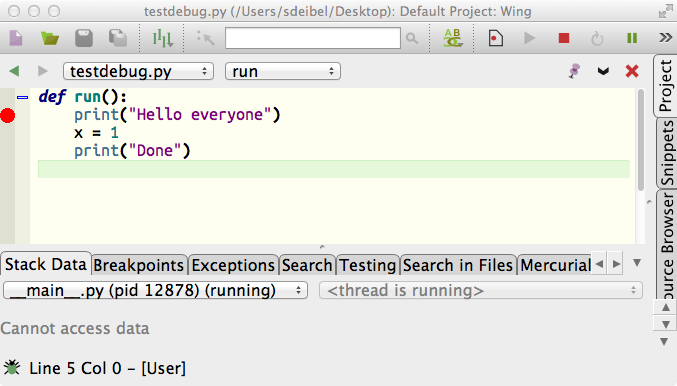
Now add the following cell to your Jupyter notebook:
import testdebug
testdebug.run()
When you execute that cell, Wing should stop on the breakpoint in testdebug.py:
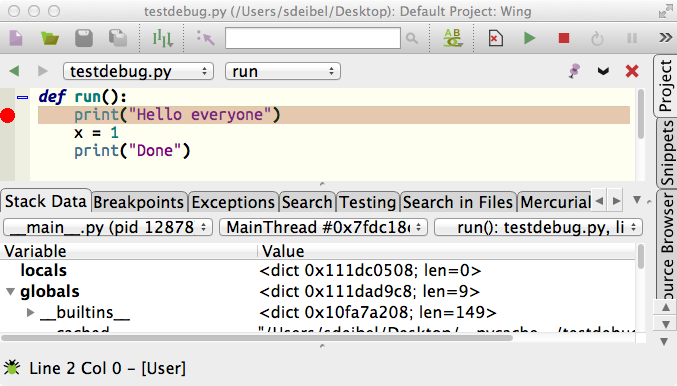
Now you can use the toolbar icons to step through code, view data in the Stack Data tool in Wing, interact in the context of the current debug stack frame with the Debug Console (Wing Pro only), and use all of Wing's other debugging features on your code. See the Tutorial in Wing's Help menu for more detailed information on Wing's debugging capabilities.
To complete execution of your cell, press the green continue arrow ![]() in the
toolbar. Now if you execute the cell again, you should reach your breakpoint a second
time. Then continue again to complete execution of the cell.
in the
toolbar. Now if you execute the cell again, you should reach your breakpoint a second
time. Then continue again to complete execution of the cell.
Editing Code
Now try editing code in testdebug.py to change Hello world to Hello everyone and save the file. If you execute your cell again in Jupyter you'll notice the text being output has not changed. This is because the module has already been imported by Python and Jupyter is not automatically reloading it. To load your changes you'll need to restart the kernel from Jupyter's toolbar or its Kernel menu. In many cases Restart and Run All in the Kernel menu will be the most efficient way to reload your code and get back to your breakpoint.
Try selecting the Source Assistant from Wing's Tools menu and then adding some other code in testdebug.py, for example add z = yy for your code reads as follows:
def run():
    print("Hello everyone")
    z = yy
    print("Done")
Notice that Wing offers auto-completion and updates the Source Assistant with call tips, documentation, and other information about what you are typing, or what you have selected in the auto-completer. If a debug process is active and the code you are typing is on the stack, Wing includes also symbols found through inspection of the live runtime state in the auto-completer. In some code, but not the above example, this can include information Wing was not able to find through static analysis of the Python code.
Working in live code like this is a great way to write new code in the Debug Console, where you can try it out immediately.
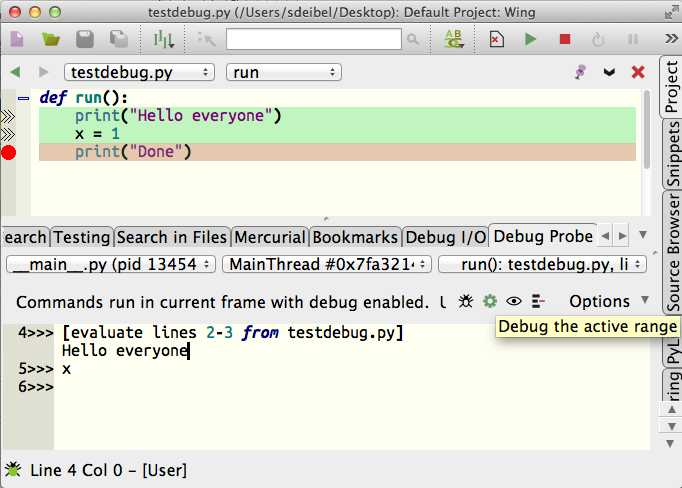
Or, you can work in the editor and try out selected lines of code by pressing the
![]() icon in top right of the Debug Console to make an active range. Once
that is done, you can execute those lines repeatedly by pressing the
icon in top right of the Debug Console to make an active range. Once
that is done, you can execute those lines repeatedly by pressing the ![]() icon in the
Debug Console:
icon in the
Debug Console:
Stopping on Exceptions
Since Jupyter handles all exceptions that occur while executing a cell, Wing will not stop on most exceptions in your code. Instead, you will get the usual report in the notebook output area.
Try this by now by restarting the Jupyter kernel and executing your edited copy of testdebug.py, which should read as follows:
def run():
    print("Hello everyone")
    z = yy
    print("Done")
Jupyter will report the exception in the notebook (undefined symbol yy), but Wing will not stop on it.
It is possible to get Wing to stop on exceptions, although currently the only way to do that is to edit code in IPython's interactiveshell.py. You can easily find that by setting a breakpoint in run() as before and going up the stack in Wing using the Stack Data or Call Stack tool. Then add the following code to the final except: clause in InteractiveShell.runcode. This will log the exception, which Wing takes as a clue that it should report the exception even though it is being handled:
if 'WINGDB_ACTIVE' in os.environ:
    import logging
    logging.exception(sys.exc_info()[1])
You will need to restart the Jupyter kernel after making this change. Then try executing your cell again and you will see Wing now reports the exception:
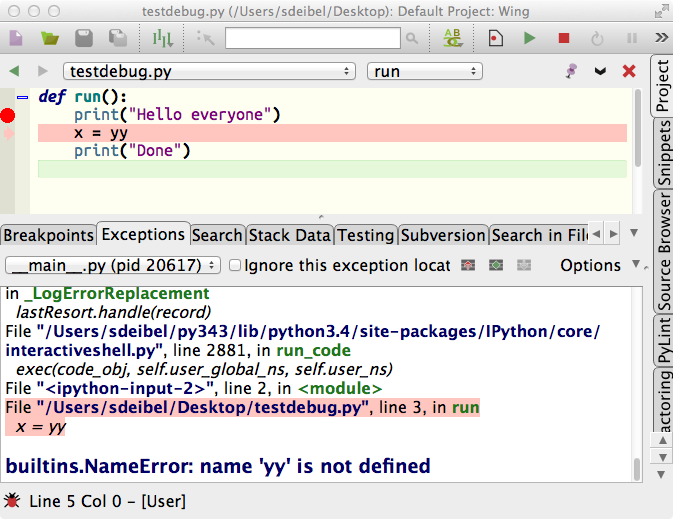
You can continue as usual from the exception and it will also be reported in the Jupyter notebook.
Fixing Failure to Debug
If you accidentally disconnect Wing's debugger from Jupyter, for example by pressing the
red stop icon ![]() in Wing's toolbar, you can reestablish the debug connection at any
time by re-executing the first cell we set up above, or by placing the following code into
any other code that gets executed:
in Wing's toolbar, you can reestablish the debug connection at any
time by re-executing the first cell we set up above, or by placing the following code into
any other code that gets executed:
import wingdbstub
wingdbstub.Ensure()
Note that if you plan to restart the Jupyter kernel every time you start debug then you don't need the wingdbstub.Ensure line. This makes sure that debug is active and connected to the IDE, so it is only needed if the debug connection has been dropped since the first time wingdbstub was imported.
If debugging stops working entirely and this does not solve it, you will need to restart the Jupyter kernel from its toolbar or Kernel menu and then re-execute the above code to start debugging again.
Reloading Changed Modules
The instructions above rely on restarting of the kernel as the way to reload changed code into Jupyter. Module reloading is also an option, making it possible to reload code without restarting the kernel.
Simple module reloading can be done using Python's builtin function reload() (or in Python 3.x instead imp.reload() after import imp). For details see instructions for reloading in IPython.
Or, for more complex cases, the autoreload extension for IPython may help.
In general module reload can be problematic if old program state is not cleared correctly, and the complexity of this depends on the modules being used and their implementations. Simply restarting the kernel is always the safest option.
Related Documents
Wing provides many other options and tools. For more information:
- Jupyter website
- Quickstart Guide contains additional basic information about getting started with Wing.
- Tutorial provides a gentler introduction to Wing's features.
- Wing Reference Manual documents Wing in detail.


