 Wingware
Tutorial: Debug I/O
Before continuing any further in the debugger, bring up the Debug I/O tool so you can watch the subsequent output from the program. This is also where keyboard input takes place in debug code that requests it.
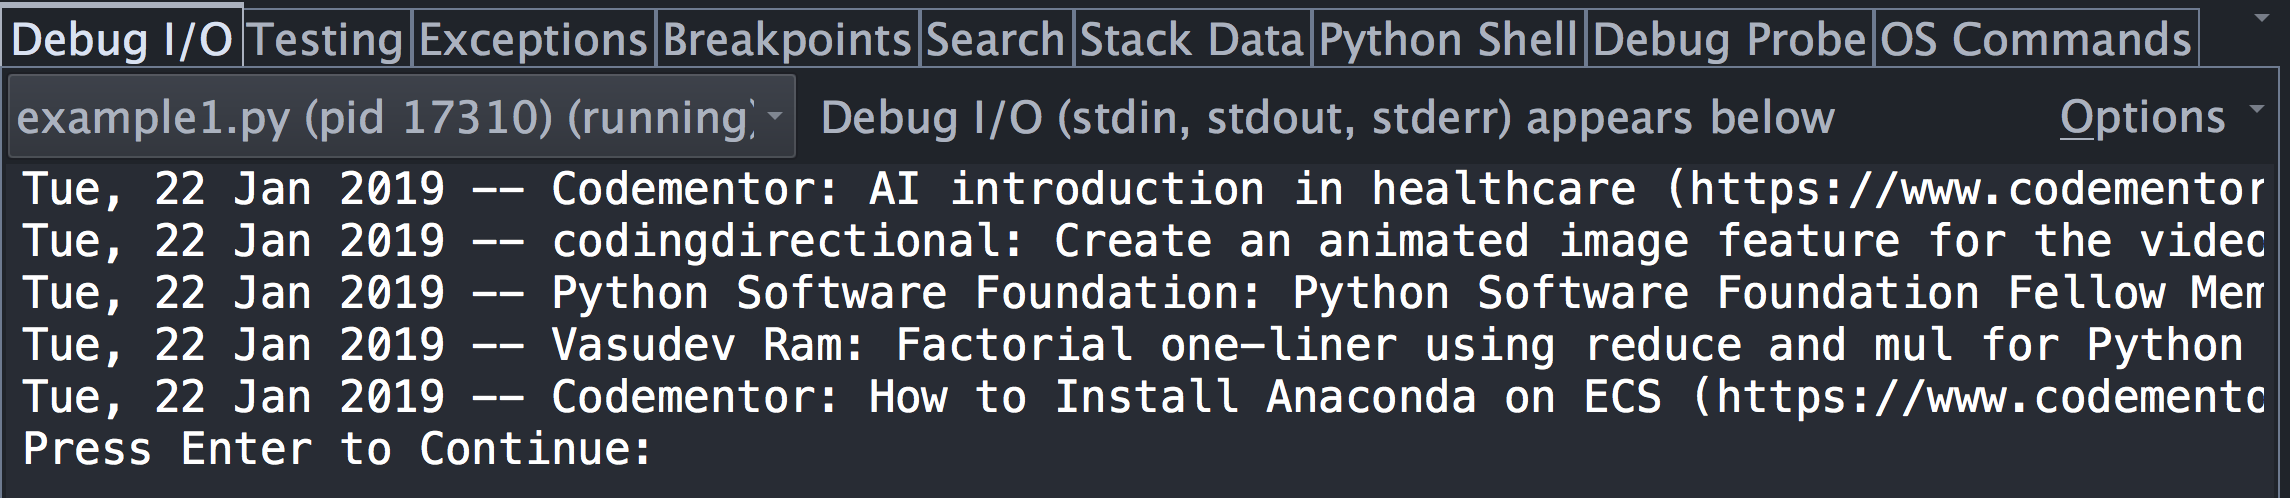
Once you step over the line PrintAsText(news) you should see output similar to the following:
For code that reads from stdin or uses input() or Python 2.x's
raw_input(), the Debug I/O tool is where you would type input to your program. Try
this now by stepping over the PromptToContinue call with  Step Over in
the toolbar. You will see the prompt "Press Enter to Continue" appear in the Debug I/O
tool and the debugger will not complete the Step Over operation until you press
Enter while keyboard focus is in the Debug I/O tool.
Step Over in
the toolbar. You will see the prompt "Press Enter to Continue" appear in the Debug I/O
tool and the debugger will not complete the Step Over operation until you press
Enter while keyboard focus is in the Debug I/O tool.
For programs that need a real terminal -- ANSI colors, cursor control, curses, getpass, terminal signals, raw input mode, or that check sys.stdout.isatty() -- enable Use Pseudo-Terminal in the Options menu of the Debug I/O tool. This runs the debug process under a pseudo-terminal connected to a built-in terminal emulator inside the tool, so most terminal-aware code works without leaving the IDE.
If the in-IDE terminal is not sufficient, you can fall back to running the debug process in a separate native console window with Configure External Console... from the same Options menu.
See Debug Process I/O for details.