Tutorial: Interactive Debugging
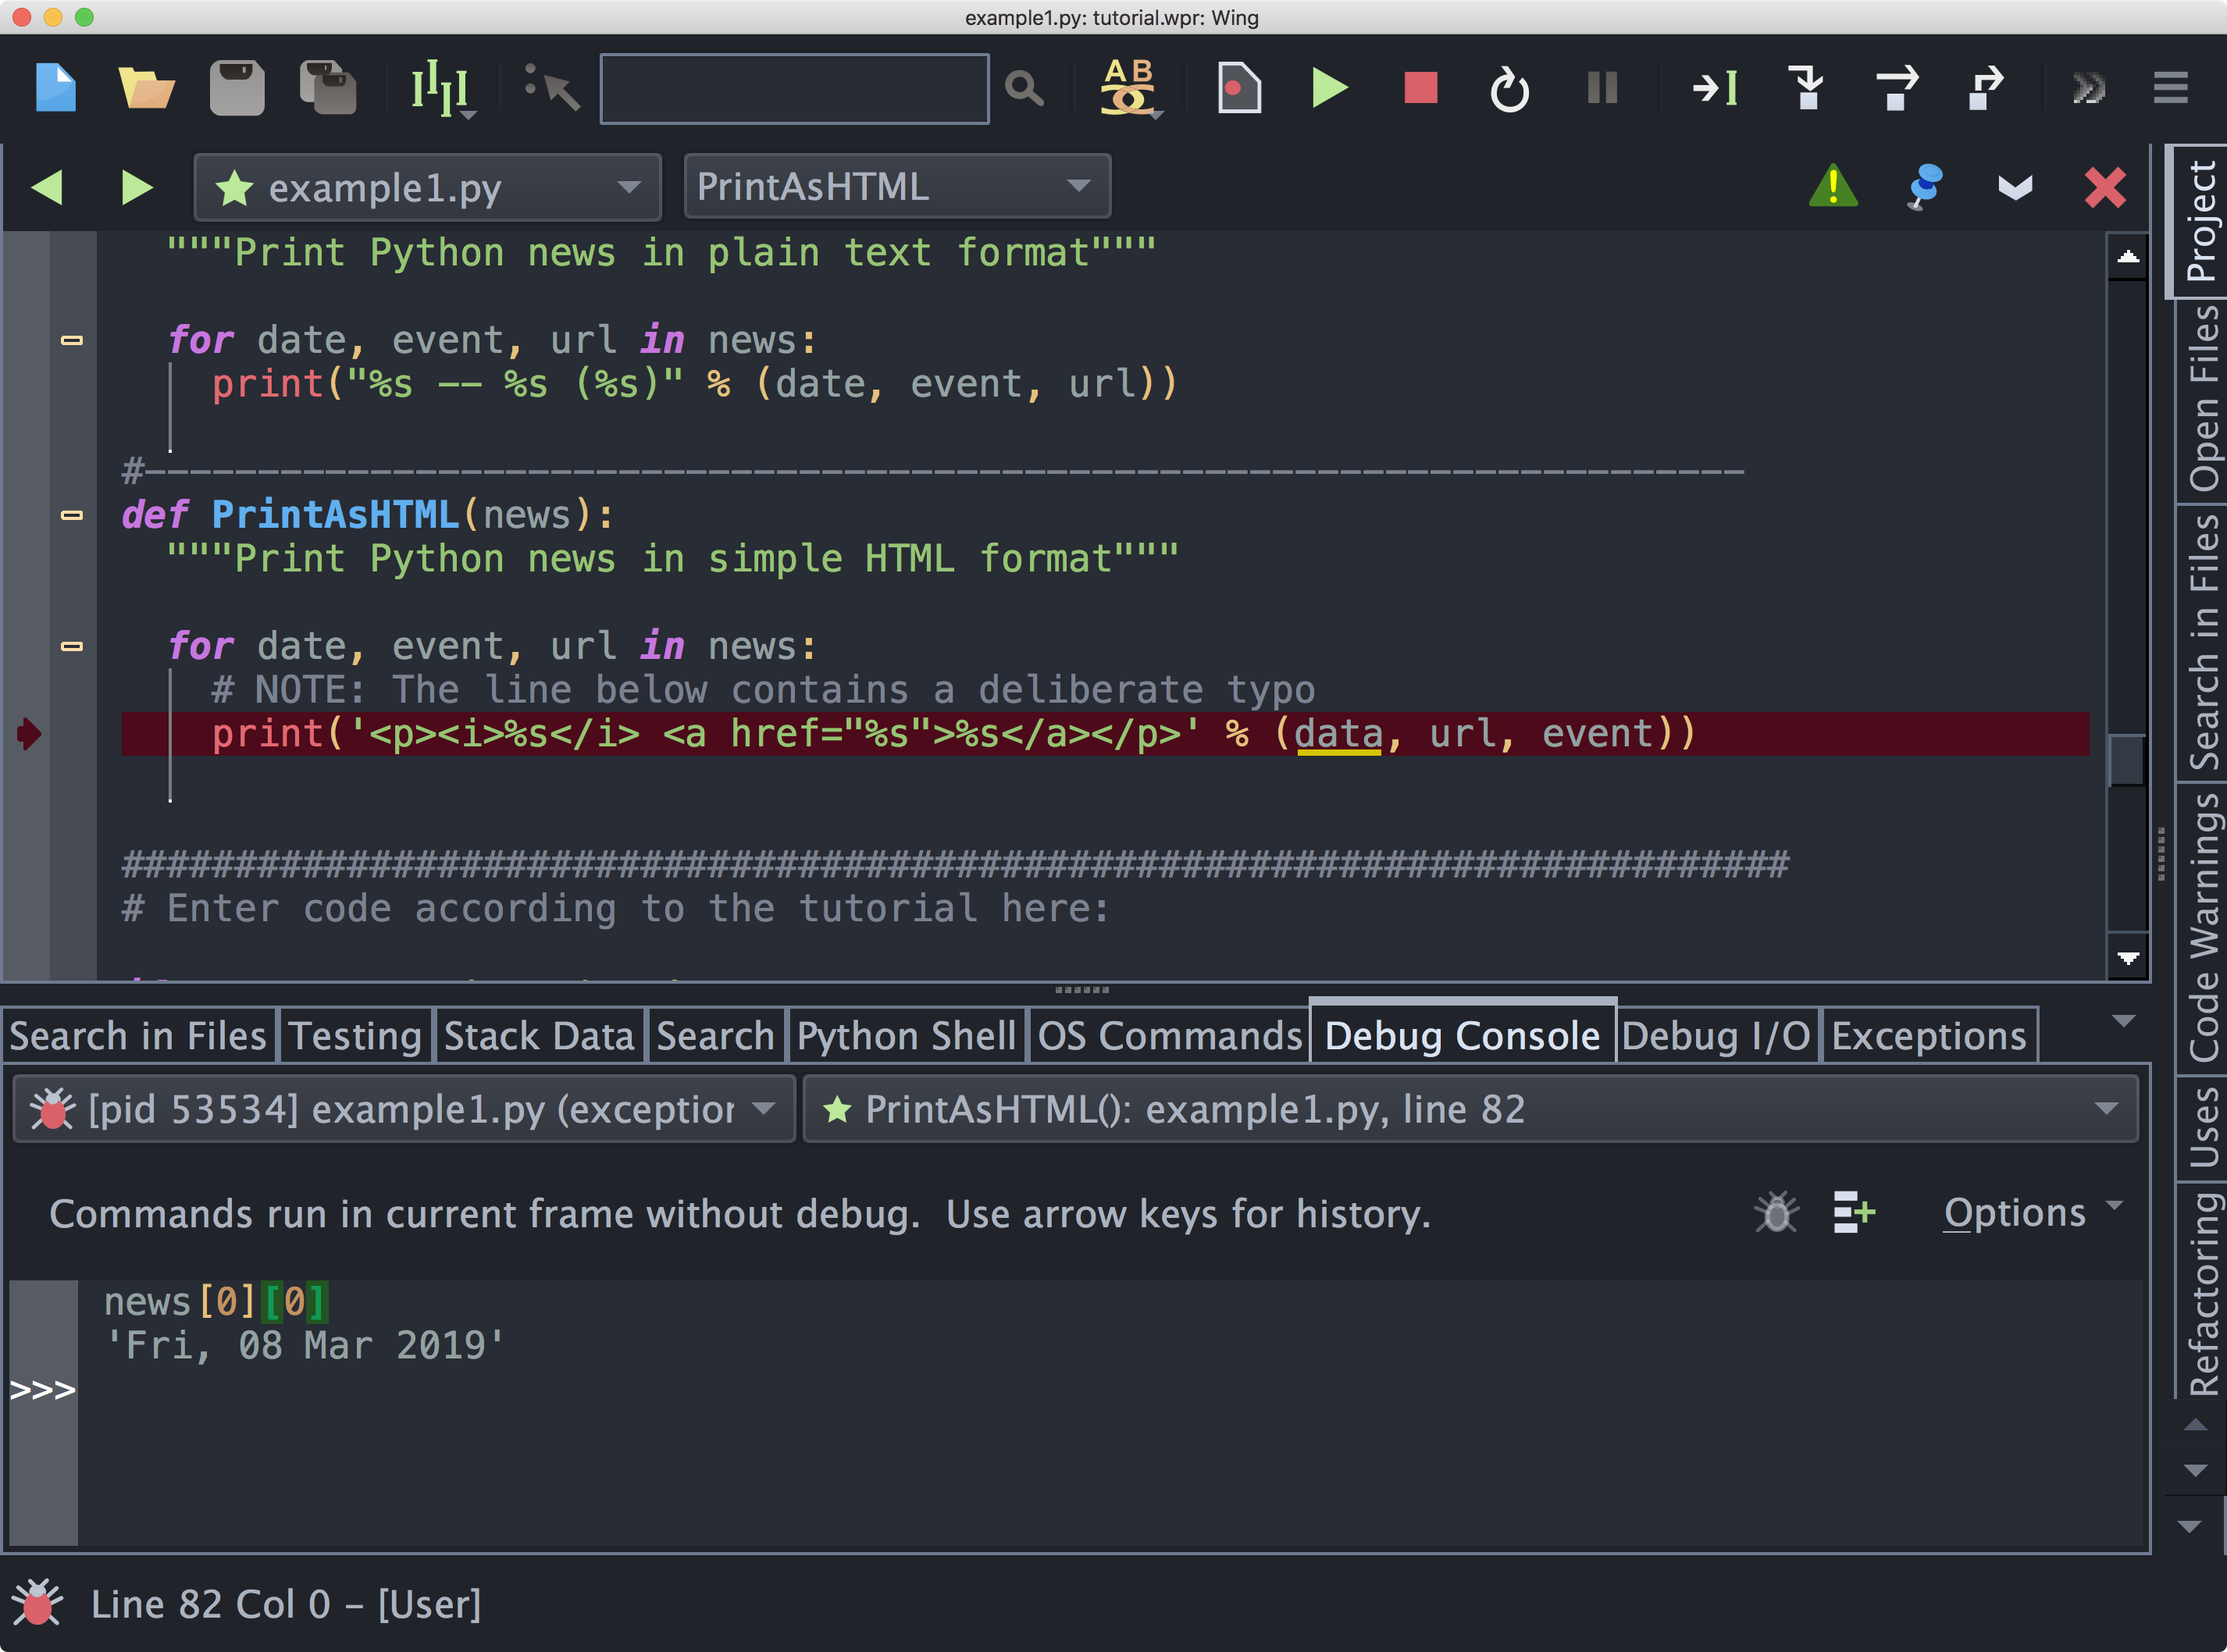
Wing Pro's Debug Console provides a powerful way to find and fix bugs, and to try out new code interactively in the live runtime state. This works much like the Python Shell tool but lets you interact directly with your paused debug program, in the context of the current stack frame:
Try it out from the point of exception reached earlier by typing this:
news[0][0]
This will print the date of the first news item:

Wing offers auto-completion as you type and shows call signature and documentation information in the Source Assistant, just as it does when you work in the editor.
Next, try this:
news[0][0] = '2013-06-15'
This is one way to change program state while debugging, which can be useful when testing out code that will go into a bug fix. Try this now:
PrintAsText(news)
This executes the function call and prints its output to the Debug Console using the modified value for news.
Here is another possibility. Copy/paste or drag and drop this block of code to the Debug Console:
def PrintAsHTML(news):
  for date, event, url in news:
    print('<p><i>%s</i> <a href="%s">%s</a></p>' % (date, url, event))
This replaces the buggy definition of PrintAsHTML found in the example1.py source file for the life of the debug process, so that you can now execute it without errors as follows:
PrintAsHTML(news)
The Debug Console is useful in designing fixes for bugs that depend on lots of program state, or that happen in a context that is hard to reproduce outside of a debugger.
See Interactive Debug Console for details.
Conditional Breakpoints
Since the Debug Console is all about working in a selected runtime context, now is a good time to take a look at conditional breakpoints, which are a good way to get the debugger to stop in the context you want to work with.
To set a conditional breakpoint, right-click on the breakpoint margin to the left of the editor and select Set Conditional Breakpoint. This brings up a dialog in which you can enter any Python expression. If the expression's truth value is True, or if it raises an exception, then the debugger will stop on it. If the expression is not True then the debugger will continue running.
Try this now by first selecting Remove All Breakpoints from the Debug menu and then setting a conditional breakpoint on the print within the for loop in PrintAsText. Use a conditional such as 'beta' in event. You will need to replace the word beta with some other word or fragment to get the debugger to stop here, since this depends on the news items that are currently listed on python.org. Look at the output from your previous runs of example1.py to find a word that appears in only one of the news items.
Once this is done, press the ![]() Restart Debug icon in the toolbar or select
Restart Debugging in the Debug menu. Wing should stop on your conditional
breakpoint in the loop iteration where it is True. In more complex code, this would be
a quick way to get to the program state that is causing a bug or for which you want to
write some new code.
Restart Debug icon in the toolbar or select
Restart Debugging in the Debug menu. Wing should stop on your conditional
breakpoint in the loop iteration where it is True. In more complex code, this would be
a quick way to get to the program state that is causing a bug or for which you want to
write some new code.
See Setting Breakpoints for details.
Working in the Editor While Debugging
When the debugger is active, Wing uses both its static analysis of your code and introspection of the live runtime state to offer auto-completion, call tips, and goto-definition in the editor, whenever you are working in code that is active on the debug stack.
Try this now by typing the following in the Debug Console:
testvar = 'test'
Then switch to example1.py and in PrintAsText (where you are currently stopped on a conditional breakpoint) create a new line and type this:
test
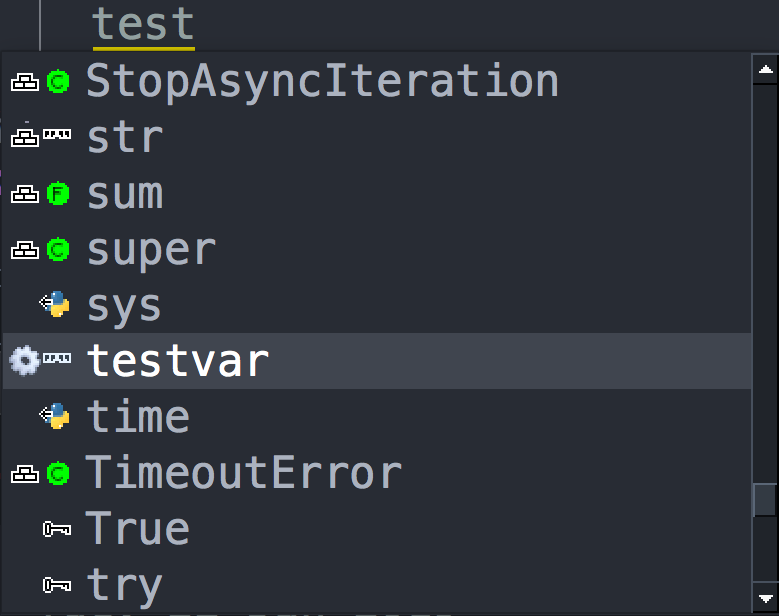
Notice that the newly created variable testvar shows up in the completer, with a cog icon to indicate that it was found in the runtime state:

This is a handy way to get correct auto-completion in dynamic code where static analysis is not able to find all the symbols that will be defined when code is executed.


