Wing Tips: Live Interactive Python Coding in Wing Pro
This Wing Tip describes how to use the debugger in Wing Pro to write new Python code with direct access to the runtime state that the code is intended for, so you can immediately try out the code that you write. This is a far more efficient way to write most code, compared with working offline.
The key to working interactively in Wing is to run the debugger to a breakpoint in the
code that you are working on. Once this is done, the auto-completer and other code
intelligence features in Wing use both static analysis and runtime type analysis in
code that is active on the debug process stack. The source of a symbol in the completer is
indicated with the ![]() cog "runtime" icon.
cog "runtime" icon.
In this context, you can immediately try out newly written code, and retry it as often as needed after correcting errors, by executing it in Wing Pro's Debug Console tool. You do need to be mindful of what the (possibly incorrect) code that you try does to the runtime state and restart the debugger if it becomes invalid. But in most cases it is possible to re-run corrected code and work iteratively without restarting your code.
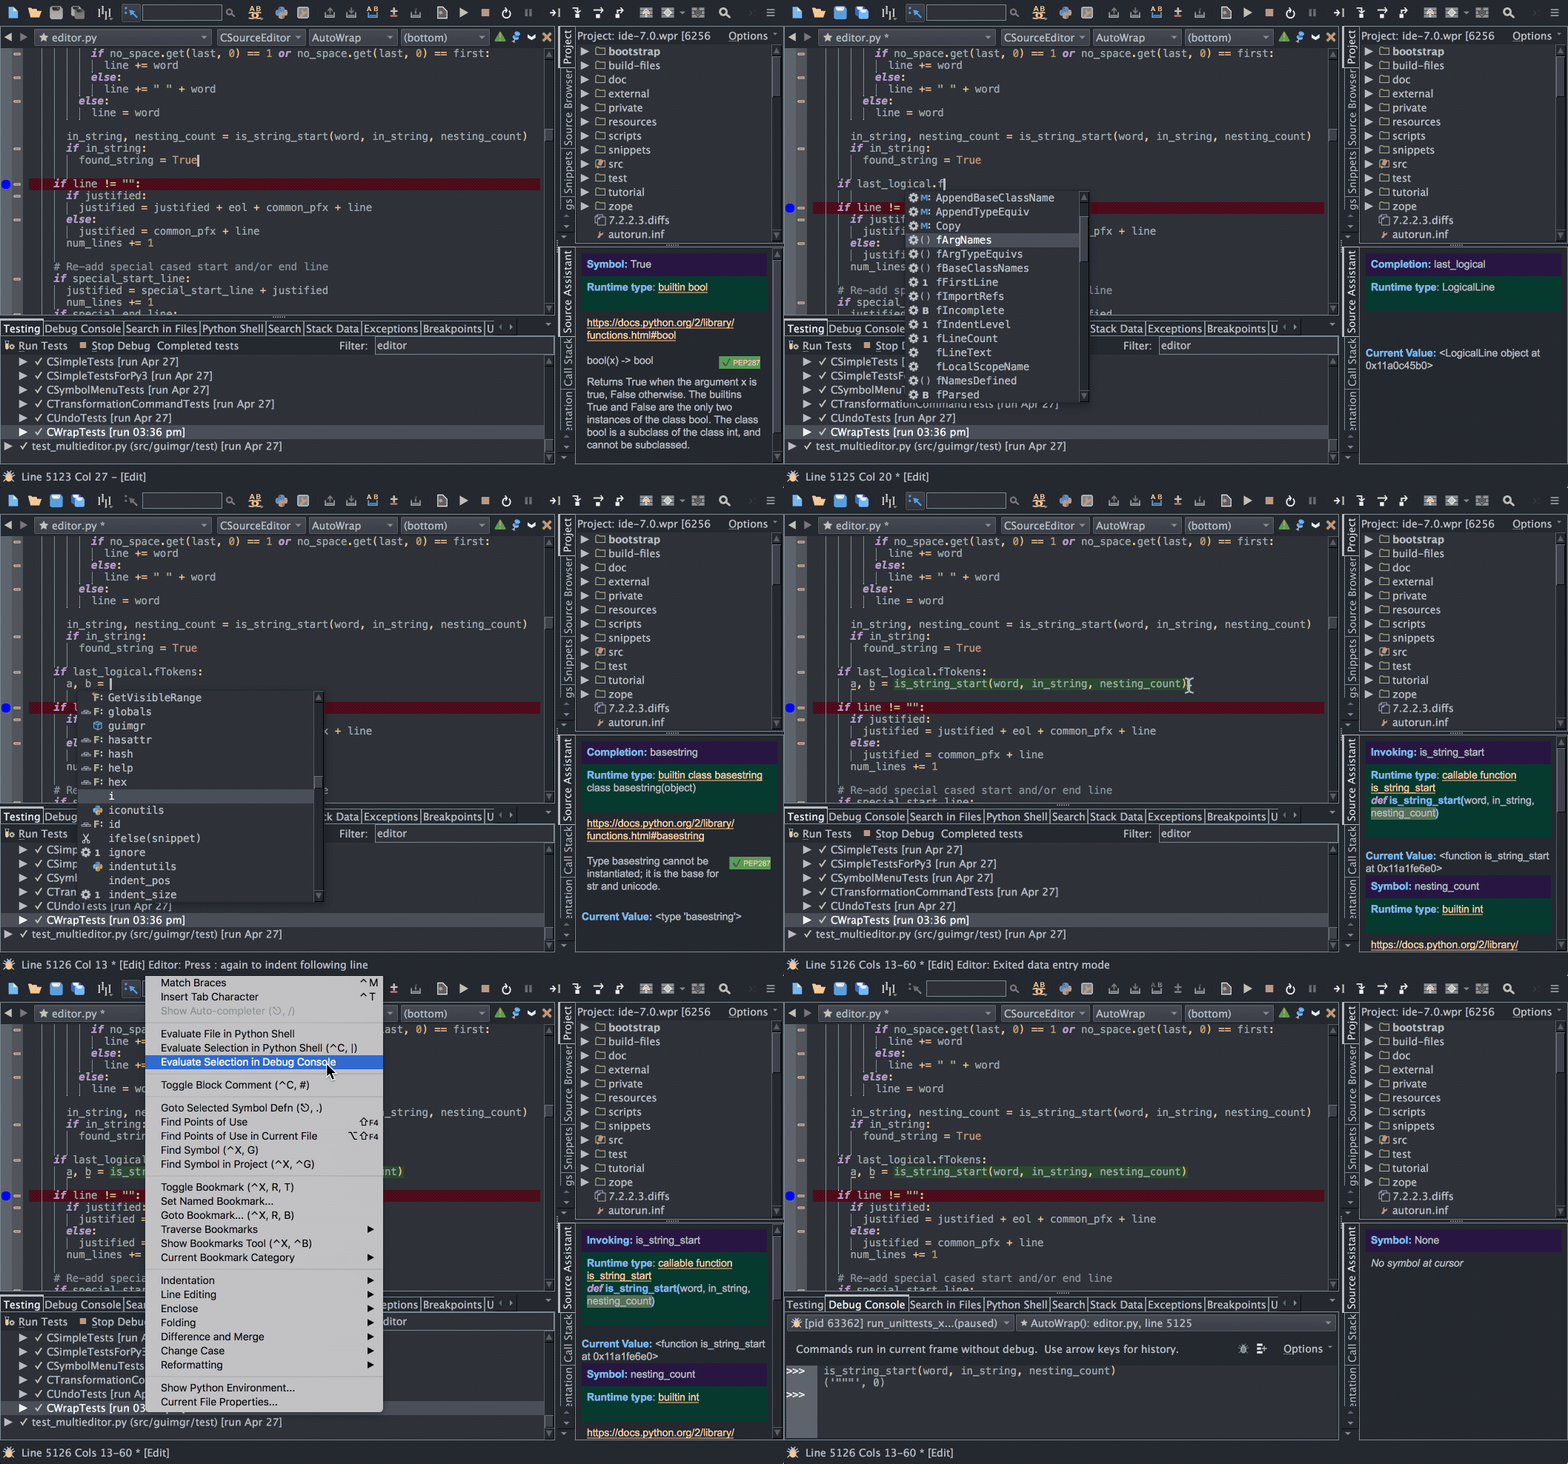
Here is an example of live interactive coding in Wing Pro after running to a breakpoint in the editor:

Shown above: Entering code while the debugger is at a breakpoint, with auto-completion and auto-editing features that inspect the live runtime state of the debug process, then trying out an invocation in the Debug Console.
Notice that the above example uses a conditional breakpoint, as described in the previous Wing Tip. These are a great way to select the specific runtime case for which you want to write new code, for example to fix a bug that occurs only in a particular scenario.
Active Ranges
The above example simply copied and pasted code into the Debug Console in order to try it out. In many cases it's easier to select a range of lines that you are working on and mark those as the "active range", so that they can be executed and re-executed repeatedly as needed.
This is done by selecting the lines in the editor and pressing the ![]() active
range icon in the top right of the Debug Console. Once an active range is set, the
active
range icon in the top right of the Debug Console. Once an active range is set, the
![]() icon in the Debug Console will execute it in the current debug stack frame.
icon in the Debug Console will execute it in the current debug stack frame.
See the Interactive Debug Console documentation for details.
That's it for now! We'll be back soon with more Wing Tips for Wing Python IDE.
As always, please don't hesitate to email support@wingware.com if you run into problems or have any questions.
Share this article:


