
Debugging with Wing Pro
Wing's powerful Python debugger is designed not just to isolate and fix bugs, but also to enable efficient interactive development of new code. Wing's debugger works with all forms of Python code, whether launched from the IDE, run by a web server or web framework, invoked as a script in an embedded copy of Python, or executed on a remote host, container, or cluster.
Powerful Debugger Interface
Wing Pro provides all the Python debugger features you would expect, and much more. You can set breakpoints to stop in your code, either in the editor, or within the Python Shell. Then inspect data on the stack, in loaded modules, or by hovering over symbols in the editor. Stepping can be by instruction, statement, or block of code. Debug can be started within a selected file, or from code invoked in the integrated Python Shell.
Interactive Debug Command Line
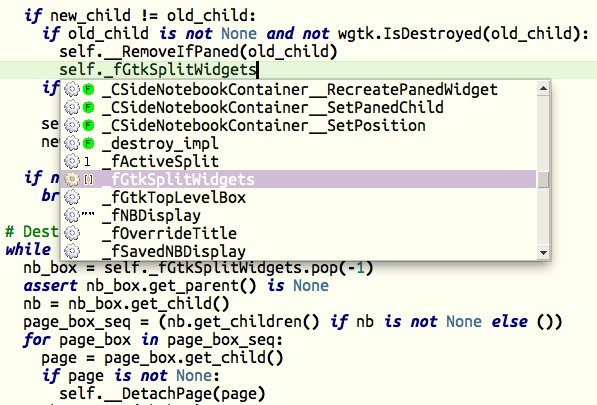
Wing Pro's Debug Console is an auto-completing Python shell that executes in the context of the current debug stack frame. This is a powerful way to inspect data and interact with your runtime, in order to understand a bug and then design and test a fix. Goto-definition can be used on anything you type to visit the code you are invoking, and Wing continuously updates context-sensitive documentation as you work.
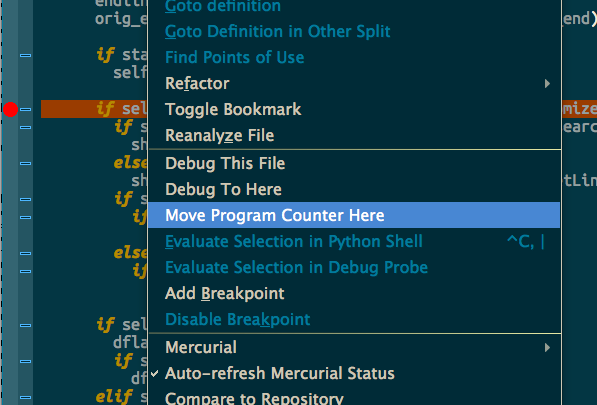
Move Program Counter
Move Program Counter rewinds the position of the current line of code in the bottom-most stack frame, so you can go back and step through a failing case without having to restart debug.
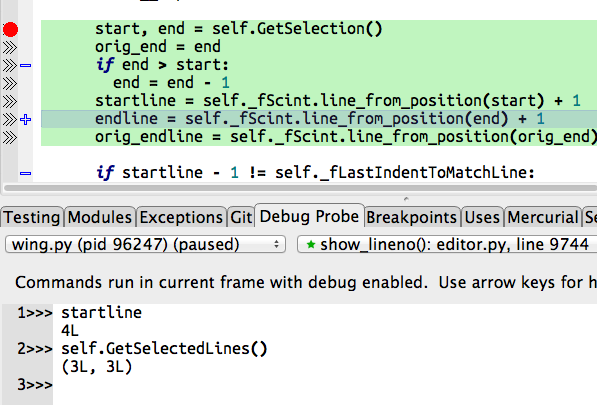
Live Runtime Development
Wing's editor works seamlessly with the debugger, so its code intelligence features can also take advantage of the live runtime state. Active Ranges can be set to easily try out lines of code as they are being written in the editor. The debugger is fully integrated with Wing's unit testing features, so interactive development can be test-driven as well.
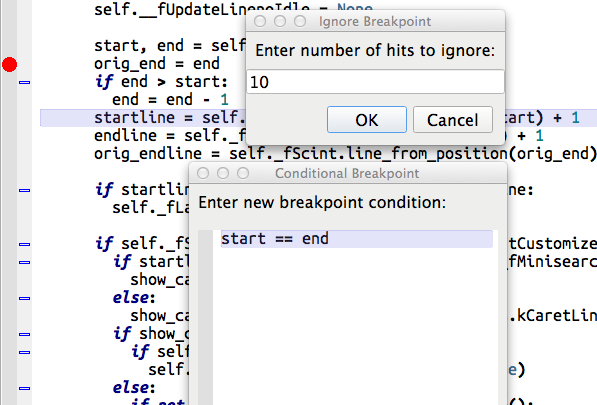
Conditional Breakpoints
Conditional and ignore-counted breakpoints can be used in code that is called many times, in order to isolate and fix a bug affecting only a particular case. The debugger also stops automatically on unhandled and printed exceptions.
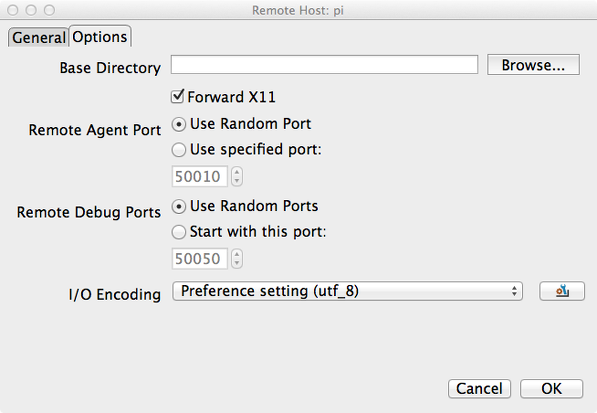
Remote and Container Development
Wing's powerful remote development support can launch remote code from the IDE. Or, you can configure Wing to debug code launched externally on the remote host, for example in response to a browser page load. Wing can also debug code running in an embedded copy of Python, where it is used to script a larger application, in containers such as those managed by Docker or LXC/LXD, and on clusters managed by Docker Compose.
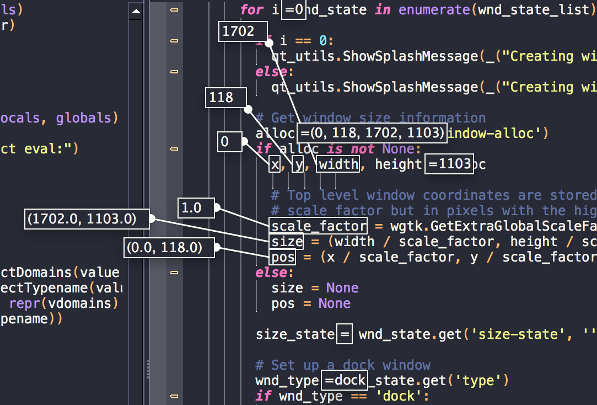
Debug Data Overlay
Pressing Shift-Space while the debugger is paused or at a breakpoint or exception displays the values of all visible symbols and dotted names inline in the editor. Individual values can be seen by hovering over a single symbol or dotted name.
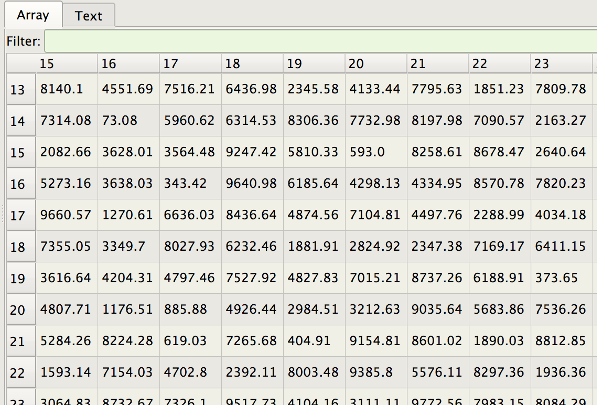
Array and Data Frame Viewer
Wing's array viewer can inspect numpy ndarrays, Pandas DataFrames, xarray.DataArrays, sqlite3 query results, and Python's internally defined data types. The viewer loads data incrementally as needed for display, so it can be used with very large data sets. The display can be filtered with text, wildcard, or regular expressions to match one or more rows, optionally matching on specific columns.
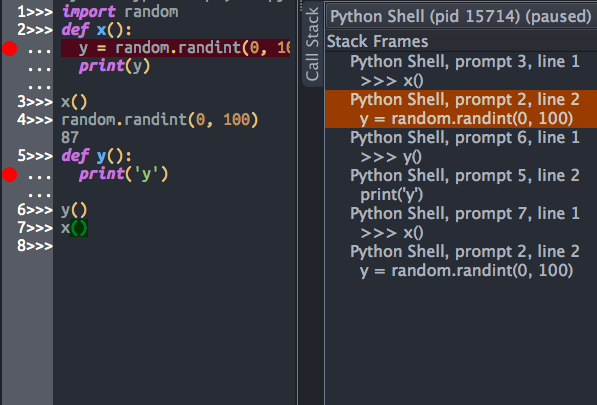
Recursive Debugging
Wing's integrated Python Shell and Debug Probe both support recursive debugging, so you can debug new code even if you are already stopped at a breakpoint or exception in your debug session.
and Much More
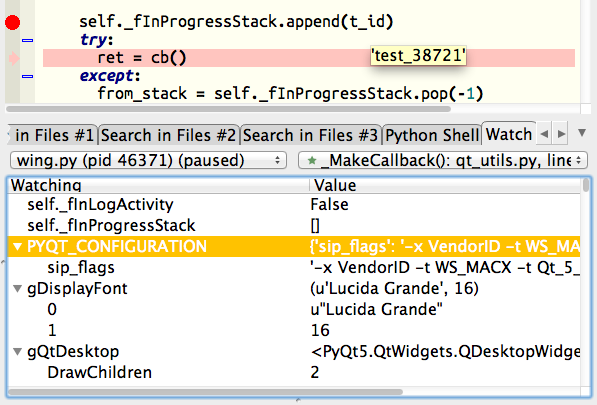
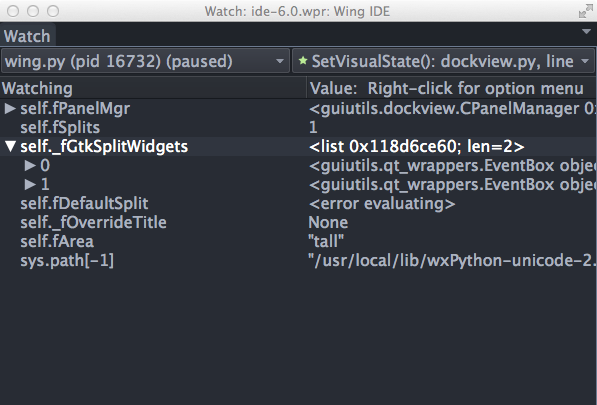
Wing can debug multi-threaded code and multiple processes, including automatically initiating debug in child processes. The debugger may be configured to report exceptions that are likely to indicate a bug, such as AssertionError, even if the exception is handled. Wing can watch debug data over time by symbolic name, object reference, or a combination of both, so data that goes out of scope while stepping is still available for inspection. Code may be debugged in different environments defined in Launch Configurations, and Named Entry Points define common debug entry points.